
What Is a Candlestick?
A candlestick is a graphical representation of how the price of a financial asset (such as a currency pair, stock, cryptocurrency, or commodity) moves during a specific period of time. Each candlestick summarizes four important prices:
- Open – the price at which the trading period began.
- High – the highest price reached during the period.
- Low – the lowest price reached during the period.
- Close – the price at which the trading period ended.
A single candlestick tells traders whether buyers or sellers were in control during that period. If the closing price is higher than the opening price, the candlestick is typically bullish (often shown in green), indicating buying pressure. If the closing price is lower than the opening price, it is bearish (often shown in red), indicating selling pressure.
Candlesticks are one of the most widely used charting tools in online trading because they allow traders to quickly understand market sentiment and identify potential trends, reversals, and trading opportunities.
Beginner Tip: Think of a candlestick as a "snapshot" of the market during a specific time frame. Whether you're looking at a 1-minute chart or a daily chart, each candlestick tells the story of what happened to the price during that period.
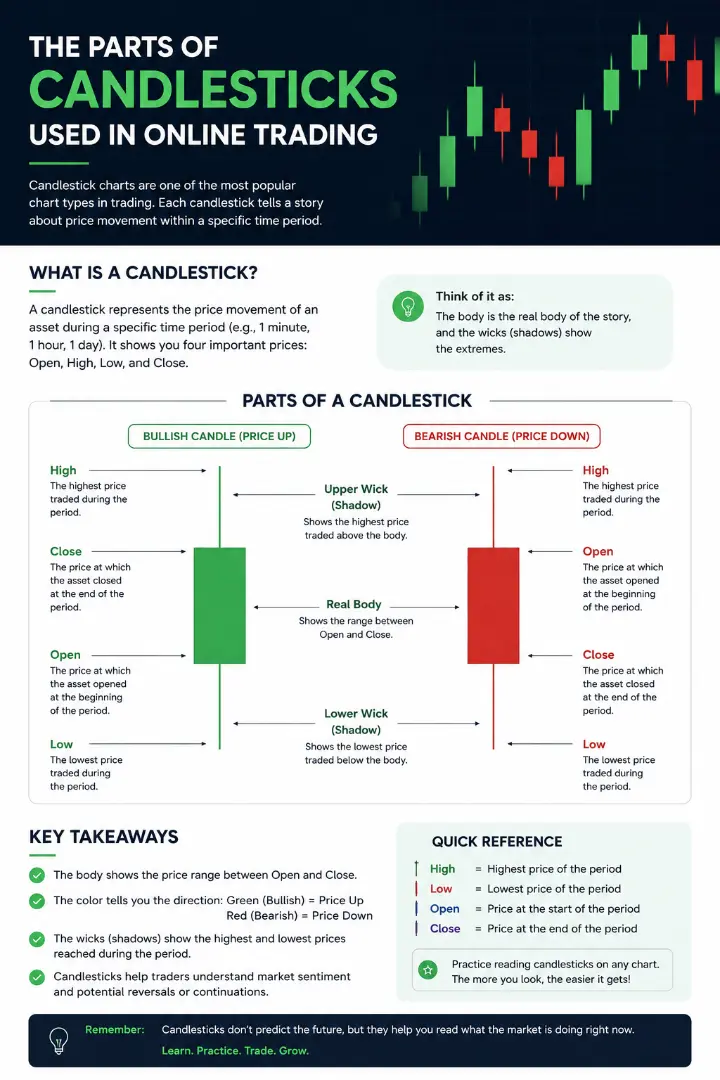
Parts of Candlesticks Used in Trading Different Financial Markets